This report is used for analyzing Distribution via Codes. It contains Distribution via codes activation data.
1. Go to “Reports” (red arrow on Exhibit 1) and select “Distribution via codes activations” (green arrow on Exhibit 1).

Exhibit 1
2. In the “Select Distribution via Codes” field (blue arrow on Exhibit 2) in the drop down menu, select the name of the distribution via codes for which you want to generate a report.

Exhibit 2
3. The report will be generated automatically.
Data Display Options in the Report
1. Use the box above the chart (blue arrow on Exhibit 3) to select data display by day, week, month or year.

Exhibit 3
2. Moving the cursor along the chart, you can see the number of codes generated (red arrow on Exhibit 3) and activated (yellow arrow on Exhibit 3), and of licenses activated (green arrow on Exhibit 3) on any particular day.
3. If desired, some data may be excluded from the report. To do that, click on the corresponding color box above the chart (blue arrow on Exhibit 4). It will now appear checked, and this data will not be shown on the report (Exhibit 4).
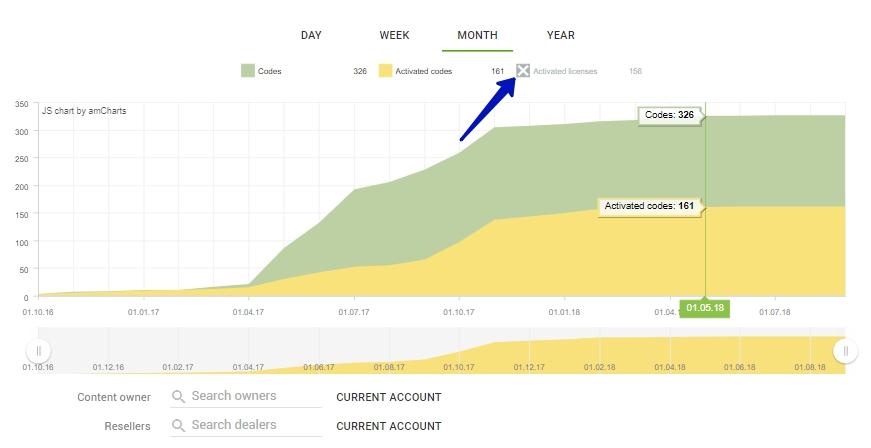
Exhibit 4
4. Once you position the cursor over a color box above the chart, the chart will only show the data you pointed the cursor at (Exhibit 5).

Exhibit 5
5. To change the time period covered in the report, grab one of the buttons marked with blue arrows on Exhibit 6 with your mouse and drag it left or right as desired.

Exhibit 6
6. To see details for any particular content owner or reseller, select the desired name in the “Content Owner” (blue arrow on Exhibit 7) or “Reseller” (green arrow on Exhibit 7) fields.

Exhibit 7